What’s Next Beyond the Shelf: Comparative Signals for Makeup Packaging Manufacturers in an Omnichannel Era
Setting the Scene: Fast Clicks, Slower Packs
Here’s the shift: shelf power is moving to screen time, and speed wins. Make up packaging manufacturers face buyers who judge packs by a thumbnail before they ever hold them. In many launches, a fresh lip tint ships with glossy cartons and sturdy jars, yet the cart still stalls. Data from retail UX tests shows shoppers decide in under eight seconds; most never tap “details.” For makeup packaging companies, the carton edge, cap shape, and copy weight need to do more with less (sige). That’s a tall order when supply paths still run on long lead times and batch-first forecasts.
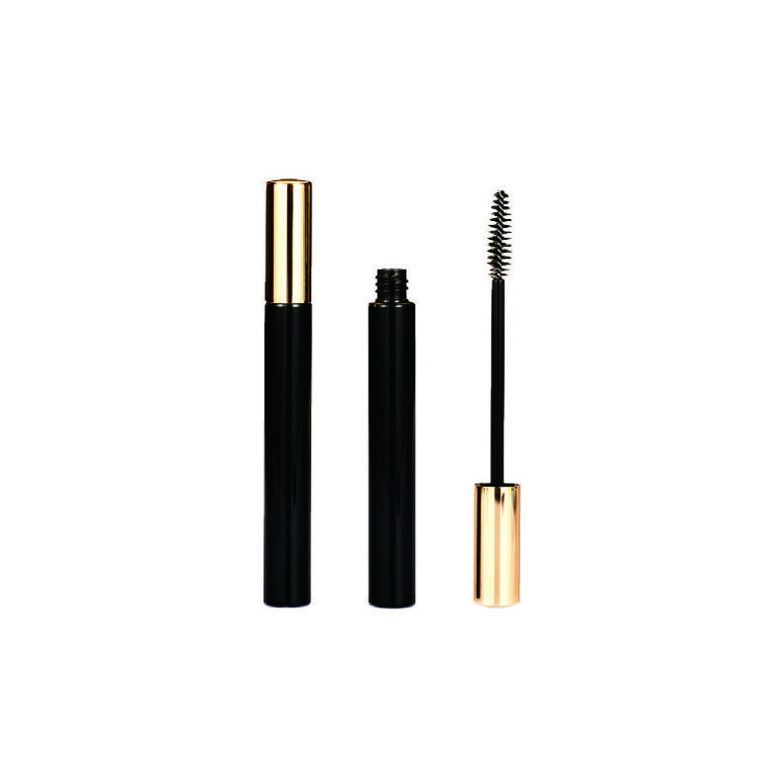
The scenario is familiar: an eye-catching mockup, rich silkscreen, maybe PCR resin to meet the eco brief—then returns spike due to scuffs, color mismatch, or pump drift. So we ask, what part of the pack story isn’t visible, but drives the outcome? In short, the unseen rules the seen. It’s the tiny tolerances, the freight bumps, the picking slips. And yes, it adds up—fast. Let’s step through the gaps and set up a smarter comparison for what to change next.
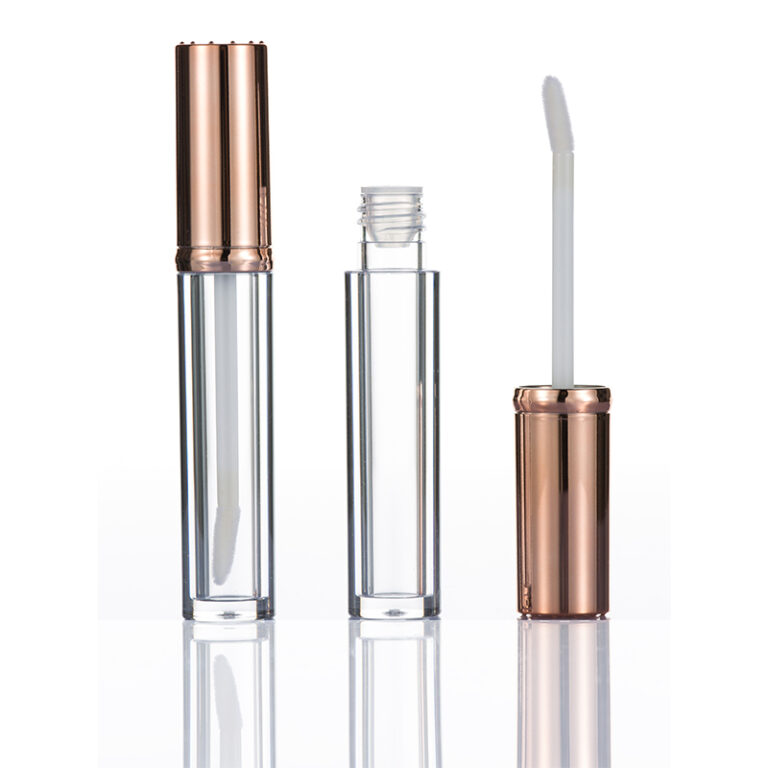
Hidden Friction Points You Don’t See on the Mood Board
Where do costs hide?
Let’s get technical, but clear. Many teams still treat packs as static objects. In reality, they are moving systems. Small misses compound. A cap designed for one thread pitch meets a bottle from a different mold family; torque tests fail; micro-leaks follow. Traditional fixes rely on bigger safety margins, slower lines, and more QC sampling. Look, it’s simpler than you think: the old approach is blind to variance. Injection molding drift, anodized aluminum shade shifts, and label stretch under heat all pile on. Then the thumbnail image online betrays the mismatch—funny how that works, right?
Another pain point hides in data deserts. Teams track unit cost, not the cycle. They skip life-cycle assessment (LCA) until late, so PCR content becomes a last-minute swap, altering flow and wall thickness. Freight choices ignore drop-test profiles, so corners crush and returns climb. Carton dielines look lean, but cull rate spikes when humidity hits. And the buyer? They feel it as messy lids, scuffed foil, or pumps that burp. When that happens at scale, the brand eats it in CS tickets and discounts. The lesson: we don’t have a design problem; we have a system clarity problem.
Comparative Outlook: Principles That Make the Pack System Smarter
What’s Next
Now, let’s compare what’s changing. New principles work like glasses for a blurry process. First, spec coherence. Instead of “good-to-go,” define fit with tolerance stacks and simulate closure force. Digital twins for assemblies let you test thread engagement, headspace, and seal geometry before metal cuts. Pair that with spectrophotometer-based color targets, so anodized aluminum and molded PP hit a tighter delta E. Second, monomaterial thinking. Wherever possible, snap-fit a PP pump with PP bottle to boost recovery and simplify sortation—no glue, no hidden springs. Third, workflow visibility. A capable makeup packaging supplier now exposes mold run data, UV curing windows, and transit drop profiles via dashboards. It feels more like ops than art—and that’s good.
Real-world changes follow fast. Inline vision systems catch silkscreen drift at speed; gate blush gets flagged early; rework drops. QR-based traceability links each batch to torque curves and leak-rate checks, so returns have a cause, not just a cost. Even color holds better when curing time and ambient heat are tuned together—small thing, big gain. And the sustainability brief? With early LCA gates, PCR resin grades match flow and finish, not just a press release. You move from “we hope” to “we prove.” The upside is measurable—lead time variance shrinks, scrappage falls, and thumbnails look true to life. That means trust at first tap, then repeat buys— and yes, it scales.
How to Choose: Three Metrics That Sort Real Options from Hype
To wrap up, compare solutions with numbers you can live by. One, quality fidelity: track delta E for color (target ≤1.0 for premium metal parts; ≤2.0 for molded plastics), plus torque test pass rates and leak-rate ppm. If it looks right and seals right, it ships right. Two, system efficiency: measure lead time variance in days, not averages, and scrap/rework percentage at each station. Variance is the enemy; flatten it. Three, recovery proof: verify monomaterial share by weight and post-use recovery rate, not just PCR input. LCA snapshots at design freeze and PPAP keep the story honest. Use these three, compare suppliers side by side, and you’ll see which path holds under pressure. Tara, choose with clarity, then iterate in small, tight loops. For a practical reference point, see partners like NAVI Packaging—learn the signals, keep the control, and build packs that win both on-screen and in hand.
You May Also Like

Bos555: Inspiring People to Discover Their Path to Greatness

Understanding the Success Philosophy Associated With Kaisar138
